
Key Takeaways
- Ordinal Scale ranks data without exact differences between values.
- Uses: Customer satisfaction, performance ratings, preference ranking, Likert questions.
- Features: Maintains order, qualitative, and allows comparison without precise intervals.
- Benefits: Easy grouping, clearer insights, versatile in research and surveys.
- Examples: Satisfaction levels, movie ratings, shopping frequency.
- Analysis: Use median, mode, frequency distribution, and bar charts.
- Bottom Line: Best for structured, ranked data to gain actionable insights.
Understanding how to measure and interpret data correctly is essential for research, surveys, and analytics. Among the four main measurement scales, nominal, ordinal, interval, and ratio, the ordinal scale stands out for ranking data in a specific order without specifying exact differences between values.
Whether you’re collecting customer feedback, evaluating employee performance, or conducting academic research, the ordinal scale helps capture opinions and preferences in a structured, meaningful way. This guide explores what an ordinal scale is, its key features, advantages, examples, and how to analyse ordinal data effectively.
What is the Ordinal Scale?
The ordinal scale is a type of measurement scale used to categorize and rank data in a specific order, without indicating precise differences between the ranks. In other words, it tells you which item is higher or lower, but not by how much.
Example:
When survey respondents rate satisfaction as “Very Satisfied,” “Satisfied,” or “Dissatisfied,” the order matters, but the gap between these options isn’t measurable. This makes the ordinal scale ideal for customer satisfaction surveys, preference rankings, and feedback forms.
When to Use the Ordinal Scale?
-
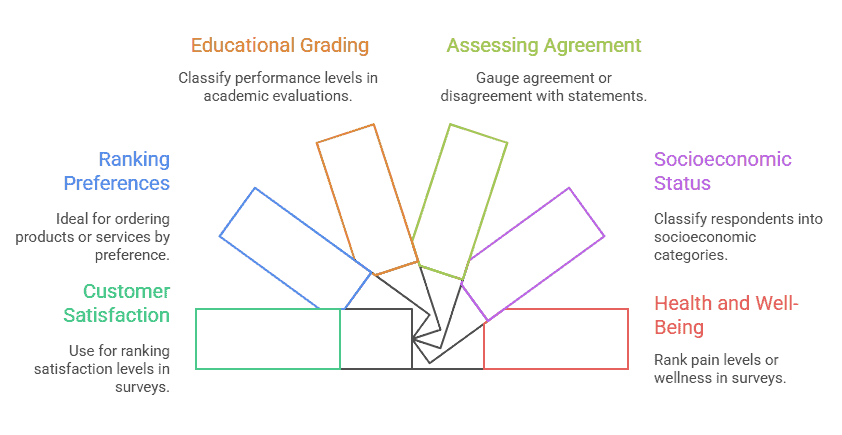
Measuring Customer Satisfaction
Use ordinal scales in surveys where respondents rank satisfaction levels, such as Very Satisfied, Satisfied, Neutral, Dissatisfied, and Very Dissatisfied.
-
Ranking Preferences
Perfect for ranking products, services, or features in order of preference without focusing on the difference between ranks.
-
Educational Grading
Ordinal scales help classify performance levels, like Excellent, Good, Average, Poor, making it ideal for academic evaluations.
-
Assessing Agreement Levels
Useful for Likert-type questions that gauge agreement or disagreement with statements, such as Strongly Agree to Strongly Disagree.
-
Measuring Socioeconomic Status
Often used in research to classify respondents like Lower Class, Middle Class, Upper Class, which follow a logical order but lack precise intervals.
-
Health and Well-Being Surveys
Helpful in ranking pain levels or wellness, such as No Pain, Mild Pain, Moderate Pain, Severe Pain.
Characteristics of the Ordinal Scale
Ordinal scales are widely used in polls, surveys, and quizzes because they allow researchers to capture opinions, preferences, and rankings effectively. Here are the key characteristics:
-
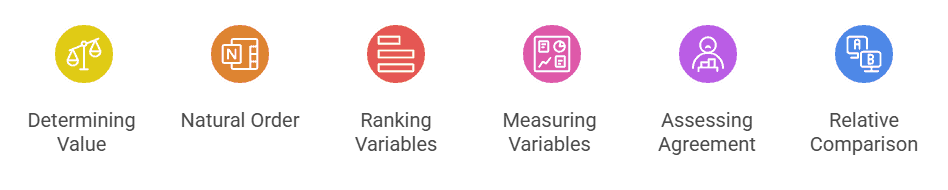
Determining Value
It assigns a position or rank to each item, helping in understanding the relative value without indicating the exact difference between them.
-
Natural Order
The categories have a clear sequence, such as high, medium, and low, which helps in interpreting the data logically.
-
Ranking Variables
Respondents can rank options based on preference or importance, making it ideal for product or feature comparison.
-
Measuring Non-Numerical Variables
Ordinal scales measure qualitative aspects such as satisfaction, agreement, or preference rather than precise numbers.
-
Assessing Agreement
Commonly used in Likert-type questions to measure attitudes ranging from strongly agree to strongly disagree.
-
Relative Comparison
While it shows which option is preferred, it does not quantify the exact difference between ranks.
Advantages of the Ordinal Scale
-
Compare Variables
It allows easy comparison between ranked categories, helping identify preferences or priorities clearly.
-
Grouping
Data can be grouped into meaningful categories like satisfied, neutral, and dissatisfied for better analysis.
-
Easy Inferences
Results are straightforward to interpret since responses are arranged in a logical order.
-
Richer Insights
It provides a deeper understanding of opinions and attitudes compared to nominal scales.
-
Versatility
Perfect for polls, quizzes, and Q&As, as it works well in collecting feedback on opinions, satisfaction levels, or choices.
Bring Your Virtual Meetings to Life

Ordinal scale examples
Below are some practical ordinal questionnaire examples that illustrate how ordinal scales work in real-world scenarios.
-
Employee performance rating:
- Outstanding
- Exceeds expectations
- Meets expectations
- Needs improvement
- Unsatisfactory
-
Frequency of online shopping:
- Daily
- Weekly
- Monthly
- Rarely
- Never
-
Satisfaction with public transportation:
- Very satisfied
- Satisfied
- Neutral
- Dissatisfied
- Very dissatisfied
-
Movie Rating
- Excellent
- Good
- Average
- Poor
- Terrible
Ordinal Scale vs Other Levels of Measurement
Nominal Scale vs. Ordinal Scale
Nominal scales classify data into distinct categories without any order, such as gender or nationality. In contrast, ordinal scales rank data in a meaningful order, like satisfaction levels, but do not indicate the exact difference between ranks.
Interval Scale vs. Ordinal Scale
Interval scales not only rank data but also measure the exact difference between values, such as temperature in Celsius. Ordinal measurement, however, shows order without specifying the magnitude of difference between the ranks.
Interval Scale vs. Ordinal Scale
Interval scales not only rank data but also measure the exact difference between values, such as temperature in Celsius. Ordinal scales, however, show order without specifying the magnitude of difference between the ranks.
Analysing ordinal scale data involves methods that respect its ordered nature. Frequency distribution is commonly used to display how often each rank occurs, providing a clear overview. Visualizing the data with bar charts or histograms helps identify patterns and trends at a glance. Measures of central tendency, such as median and mode, are appropriate since the exact difference between ranks isn’t defined. Additionally, measures of variability, like range, offer insights into the spread of responses without assuming equal intervals between categories.
The ordinal scale is a powerful tool for capturing and interpreting ranked data, especially in surveys, polls, and research where order matters but precise differences don’t. Its ability to provide structured insights without requiring complex numerical values makes it a versatile choice for businesses, educators, and researchers. By understanding its characteristics, advantages, and analysis techniques, you can leverage the ordinal scale to make informed decisions and gain meaningful insights.