Rating scale questions are one of the most effective ways to gather clear and quantifiable feedback. Whether you’re a researcher, educator, or marketer, using the right rating scale can help you measure opinions, satisfaction, and experiences with precision turning subjective responses into data you can act on.
What are rating scale questions?
Rating scale questions are survey questions that ask respondents to rate an experience, opinion, or satisfaction level using a fixed scale such as numbers (1–5, 1–10) or descriptive options (e.g., “poor” to “excellent”). They help convert subjective feedback into measurable data that can be easily analysed.
Example:
How satisfied are you with our service?
- Very Dissatisfied
- Dissatisfied
- Neutral
- Satisfied
- Very Satisfied
How to analyse rating scale questions?
Analysing rating scale questions means converting structured survey responses into clear, actionable insights. Since responses follow a defined scale (such as 1–5 or 1–10), they can be easily summarised, compared, and interpreted using the following steps.
1. Calculate the Average Score (Mean)
Add all responses and divide by the number of respondents.
Example:
If ratings are: 4, 5, 3, 4, 5 →
Average = (4 + 5 + 3 + 4 + 5) ÷ 5 = 4.2
A higher average indicates better satisfaction or performance.
2. Look at Response Distribution
Check how many respondents selected each rating. This helps reveal patterns that averages alone may hide.
Example:
- 5 (Excellent): 40%
- 4 (Good): 35%
- 3 or below: 25%
3. Identify Positive vs Negative Responses
Group responses into categories to quickly understand overall sentiment:
- Positive: 4–5
- Neutral: 3
- Negative: 1–2
4. Segment the Data
Break down responses by different groups such as:
- New vs returning customers
- Location
- Demographics
- Device used
This helps identify which audience is satisfied and which is not.
5. Track Trends Over Time
Compare results across different time periods to measure improvement or decline.
Example:
- January: 3.8
- February: 4.1
- March: 4.3
6. Interpret the Results
Convert numbers into actionable insights:
- Above 4: Strong performance
- Around 3: Needs improvement
- Below 3: Problem area
Examples of Rating Scale Questions
-
Ordinal Scale Questions
Ordinal scale questions ask respondents to rate something using an ordered scale, where response options have a clear direction — from low to high, or negative to positive. The responses show relative preference or intensity, but the gaps between scale points are not equal or measurable. For example, the difference between “Dissatisfied” and “Neutral” is not necessarily the same as the difference between “Neutral” and “Satisfied.”
Examples:
- Please indicate your level of satisfaction with our service.
- Very Dissatisfied
- Dissatisfied
- Neutral
- Satisfied
- Very Satisfied
- Rank the following features by importance:
- Price Quality
- Support
- Design
- Delivery
- What is the probability that you would suggest our services to a friend or colleague?
- Not Likely
- Somewhat Likely
- Neutral
- Likely
- Very Likely
- Rate your interest in these topics from most to least: Follow it with a topic list
- How would you rate the ease of navigation on our website?
- Very Difficult – Very Easy (1–5 scale)
- Please indicate your level of satisfaction with our service.
-
Interval Scale Questions
An interval scale is a rating scale where the gaps between numbers are equal, so the difference between 3 and 4 is the same as the difference between 7 and 8. This allows you to compare scores and calculate averages, but it does not have a true zero point.
Examples:
- Using a scale from 1 to 10, how content are you with your recent purchase?
- (1 = Not satisfied, 10 = Extremely satisfied)
- Please rate the performance of our app:
- (1 to 7 scale: Poor – Excellent)
- What is the likelihood that you will revisit our store or website?
- (1 = Very Unlikely, 10 = Very Likely)
- How do you feel about our response time?
- (1 = Very Slow, 10 = Very Fast)
- To what extent do you agree with the statement: ‘This product fulfills my requirements’?”
- (1 = Strongly Disagree, 10 = Strongly Agree)
- Using a scale from 1 to 10, how content are you with your recent purchase?
-
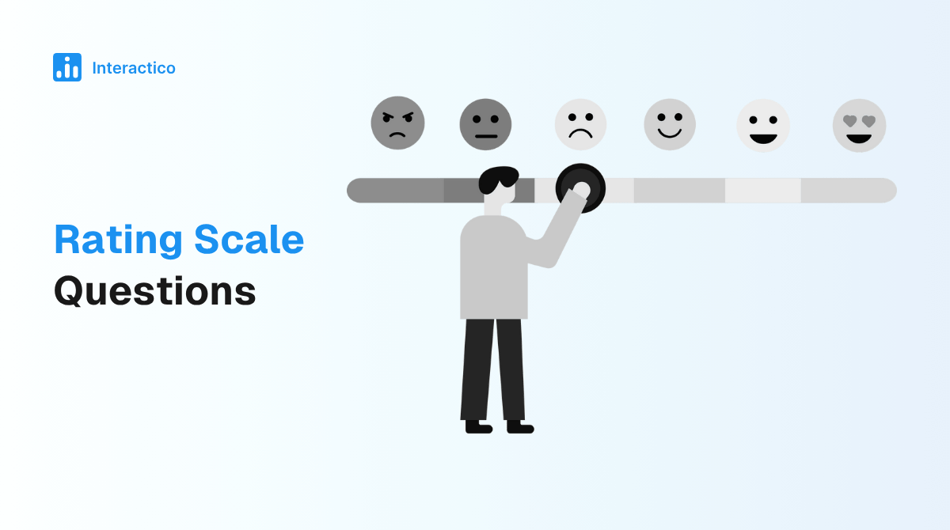
Graphic Rating Scale Questions
These questions use visual elements, such as stars, emojis, smiley faces, thumbs up/down, or sliders, to help respondents rate their experience or opinion. Instead of choosing a number or written response, users interact with a graphic interface, making the survey more engaging and intuitive.
Examples:
- Please assign a star rating (1 to 5) to reflect your delivery experience.
- Select the emoji that best represents your mood following the session.
- Rate your satisfaction using the slider: (0 to 100%)
- Tap the face that shows how you feel about our customer support: (Emoji scale)
- Select how much you enjoyed the event: (Thumbs up/down or smiley scale)
-
Descriptive Rating Scale Questions
In this type of question, each point on the rating scale is paired with a clearly defined label or description, rather than just a number or symbol. These labels help guide respondents by explaining exactly what each rating level means.
Examples:
- How would you describe the quality of support received? Options: Poor, Fair,
- Unsatisfactory
- Needs Improvement
- Acceptable
- Commendable
- Outstanding
- Please express your satisfaction level with our return policy.
- Not Satisfied
- Somewhat Satisfied
- Neutral, Satisfied
- Highly Satisfied
- How well did the session meet your expectations?
- Not met
- Partially met
- Mostly met
- Fully met
- How was the ease of setup?
- Very Difficult
- Difficult
- Neutral
- Easy
- Very Easy
- Rate your confidence in using our software:
- Not Confident
- Extremely Confident
- How would you describe the quality of support received? Options: Poor, Fair,
-
Numerical Rating Scale Questions
Numerical rating scale questions use a range of numbers,often from 1 to 5, 1 to 10, or even 0 to 100—to let respondents express their level of agreement, satisfaction, or likelihood. These scales do not include descriptive labels for each number; instead, respondents rely on their own interpretation of the numerical range.
Examples:
- On a scale of 1 to 10, how would you evaluate your overall experience?
- How effective was the workshop? (Rate 1–5)
- How likely are you to upgrade to a premium plan? (1–7)
- What’s your satisfaction score? (1–10)
- On a scale from 1 to 5, how would you rate the checkout process?
-
Comparative Rating Scale Questions
Comparative rating scale questions ask respondents to evaluate two or more options side by side based on a specific attribute,such as quality, preference, or performance. Instead of rating each item in isolation, users directly compare the items, making it easier to identify clear winners or preferences.
Examples:
- On a scale of 1 to 5, how much do you prefer Feature A over Feature B?
- Feature A (1) – Feature B (5)
- Rate the following options based on usability:
- Option 1, Option 2, Option 3 (1 = Least usable, 5 = Most usable)
- Which product performed better?
- Product A vs. Product B (1–10)
- Compare service quality before and after the update (scale 1–7)
- Which platform do you find easier to use? Web vs. Mobile (1–10)
- On a scale of 1 to 5, how much do you prefer Feature A over Feature B?
Create engaging live polls in seconds

How to Create Perfect Rating Scale Questions
- Choose an Appropriate Rating Scale
- Offer the Right Response Options
- Use the Right Distribution Channels
- Test and Optimize for Clarity and Bias
- Avoid Overloading Respondents with Too Many Questions
How to Use Rating Scales to Measure Customer Experience
-
Net Promoter Score (NPS)
How likely are you to recommend us to a friend or colleague? (0–10)
-
Customer Satisfaction Score (CSAT)
How satisfied are you with your experience today? (1–5 or 1–7 scale)
-
Customer Effort Score (CES)
How easy was it to get your issue resolved? (1 = Very Difficult – 7 = Very Easy)
Advantages of Using Rating Scale Questions
Rating scales make it easier to collect structured feedback that’s both efficient to gather and insightful to analyse. Here’s why they’re a popular choice across surveys:
-
Easy to Understand and Answer
Rating scales are easy to understand, so people are more likely to finish the survey correctly and without confusion.
-
Provides Measurable, Actionable Data
They convert subjective opinions into numerical values, ideal for identifying trends, making comparisons, and guiding improvements.
-
Allows for Quantitative Comparison
You can easily compare results across different groups, periods, or questions to track performance or sentiment over time.
-
Scalable and Flexible for Different Contexts
Rating questions work well in short polls or detailed surveys, across industries like customer service, education, product research, and HR.
-
Enhances Survey Completion Rates
Since survey rating scale questions are quick to answer, rating scales reduce friction and help improve response rates, especially on mobile or long-form surveys.
Disadvantages of Using Rating Scale Questions
While rating scales are useful, they’re not without limitations. Here are some key drawbacks to keep in mind when designing your surveys:
-
May Oversimplify Complex Feedback
Not all experiences can be captured with a number. Important emotions or issues may be missed without space for open-ended responses.
-
Lacks Context or Explanation
A low or high rating doesn’t explain why. Without follow-up questions, it’s hard to understand the reasoning behind a score.
-
Potential for Bias
Respondents might avoid extremes, their responses could be biased, or they may give socially acceptable answers rather than honest ones, skewing your data.
-
Interpretation May Vary by Respondent
One person’s “4” may mean “excellent,” while another’s might mean “good enough,” making it tricky to interpret the scale consistently.
Rating scale questions make it easy to gather clear, measurable feedback. They help you understand how people feel and where you can improve. To get even better insights, try using them along with open-ended questions.
FAQs

Anurag Bhagsain is the Founder of Interactico. With a background in SaaS, product development, and automation, he is focused on solving real world problems, especially to make meetings truly interactive. With a love for blogging, he shares practical tips on audience interaction, polls, Q&A, and meeting best practices, turning them into simple, actionable ideas. Off hours, he enjoys coding and gaming.